If you are a stocks and options trader looking to get an edge in the market, you should consider backtesting.
Backtesting assesses the viability of a trading strategy or pricing model by discovering how it would play out using historical data. If backtesting works, traders and analysts may have the confidence to employ it going forward. A well-conducted backtest that yields positive results assures traders that the strategy is fundamentally sound and is likely to yield profits when implemented in reality. A well-conducted backtest that yields suboptimal results will prompt traders to alter or reject the strategy.
- Source: Investopedia
With some solid spreadsheet skills, any trading strategy can be backtested and used to construct a trading system that can generate consistent profits. In this article, I will walk you through how I used Excel to backtest a trading strategy using Relative Strength Index.
Steps-by-Step Process in Backtesting Trading Strategies Using Excel: Tesla Example
1. Get Historical Data
The first step is to download and import the historical pricing data into an Excel spreadsheet. You can get this information from a data provider like Yahoo Finance for free. Here is the data I downloaded for Tesla. It consists of daily price—open, high, low, close, and adjusted close price—and the daily volume from when Tesla launched its initial public offering in 2010 through October 9, 2020. The price and volume data are sufficient to start building the framework for our testing.
Once the data is downloaded, I simply Copy and Paste it into my main backtest Excel spreadsheet.
Developing A Backtesting Model in Excel A quick thought on using Excel to backtest trading strategies. You will need to develop a model in Excel to automate the testing process. This requires some time upfront to build out the formulas, but once it is built, all you'll need to do is to simply import the required data into the model. The model I used includes a variety of metrics to analyze the strategy performance, such as total return, CAGR, Net Profit, # of winning trades vs. # of losing trades, and % of wins vs. % of losses.
2. Determine Which Technical Indicator(s) To Use
The next step in the backtesting process is to establish which indicator(s) you will used for your trading criteria. Depending on strategies you are looking to test, there are four main groups of indicators you can choose from: 1) Trend Indicator, 2) Momentum Indicator, 3) Volatility Indicator, and 4) Volume Indicator. These indicators are based on mathematical formula that can be calculated in Excel.
For backtesting Tesla, I decided to use Relative Strength Index (RSI), which is a Momentum Indicator used in technical analysis that measures the magnitude of recent price changes to evaluate when the price of a stock is overbought or oversold. A stock price can have a RSI range from 0 to 100, and is generally considered overbought when the RSI is close to or above 70 and oversold when it is close to or below 30.
After establishing that RSI is the indicator I'll be using, I can now calculate it on Tesla's historical price data in my backtesting Excel spreadsheet. The RSI calculation is computed with a two-part calculation as shown below:
In the spreadsheet below, I expanded the formula and compute the RSI over six columns (column AD - AI). I won't go through the specific details of the calculation in this article, but basically I used 14 periods of the adjusted close price (column M) to compute the initial RSI value.
3. Establish Initial Assumptions and Construct Your Trading Rules
With the RSI values calculated, we can now come up with some initial assumptions and construct trading rules to determine the condition under which to enter and exit a trade. I find it is easier to this by asking questions.
Some basic questions I asked for backtesting Tesla are:
What is the ideal entry point to open a long or short position on Tesla?
What should be the exit criteria for an open position?
What starting capital amount should I use?
What is the minimum and maximum position size for each trade entry?
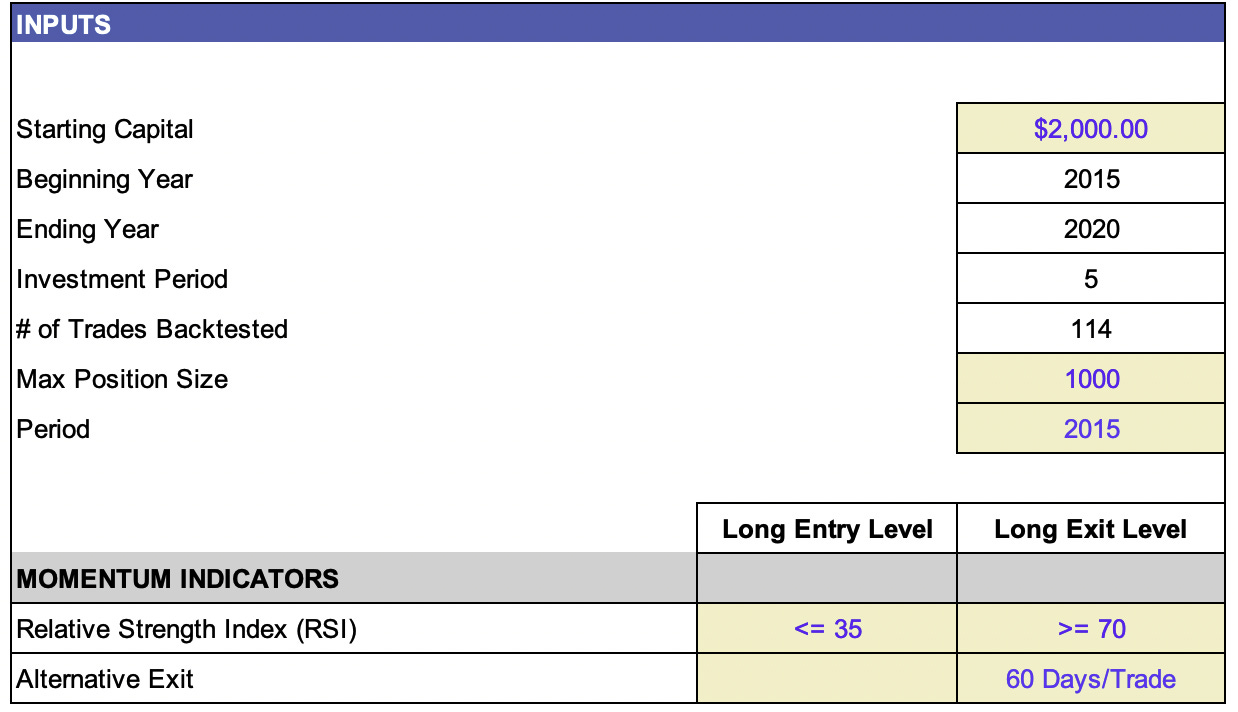
With these questions in mind, below are the criteria I came up with for Tesla. You can come up with your own criteria based on the trading strategy you are looking to test.
Initial Assumptions For Backtesting Tesla Stock:
Objective: to backtest long positions in Tesla
Starting capital amount: $2,000
Maximum position size: 1,000 shares (minimum position size is whatever amount the capital can afford. But if the account grow beyond the value of 1,000 share, I will take profit off the table and only reinvest the maximum position size)
Investment Period: 2015-2020 (5 Years)
Entry Level Criteria: If RSI is less than or equal to 35, open a long position
Exit Level Criteria: I backtested two variation of exit criteria.
The first is, if RSI is greater or equal to 70, close the long position.
The second is to hold the long position for 60 days and then close thereafter
After entering the assumptions and programing the trading logic in the Excel spreadsheet, the result was 114 possible long trades that can be backtested. We can flip the entry and exit RSI criteria were we testing short trades.
Inputs & Assumptions
4. Review The Results
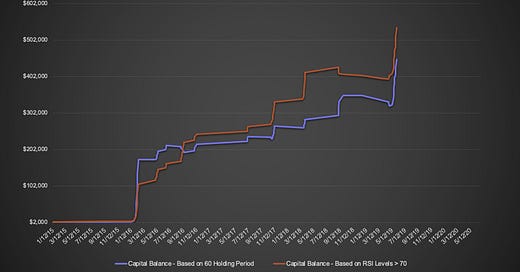
Now that we have our metrics establish, let's review the results. The best way to get a quick gauge of how profitable the trading strategy is over time is by taking a look at the capital balance graph below, which shows how the $2,000 initial capital have grown or declined over the investment period.
Graph 1: 2015-2020 Capital Balance
The important thing to look for in the graph is whether the results have been consistent overtime or whether specific market conditions influenced the outcome.
Looking at the graph, if we traded the strategy with an initial capital of $2,000 starting from 2015, our capital grew to $966K in 5 years when the exit criteria is based on the number of days held, which, as discussed earlier, was 60 days (blue line). When the exit criteria was solely based on RSI level above 70, the balance grew to $2.2M (red line).
While the results were consistent for the most part, we can see that there was a huge spike towards the end of the investment period. Obviously, this was due to the market's precipitous decline in response to the Covid-19 pandemic in March 2020, and the subsequent V-shaped recovery. Considering that this was an anomalous event, let's take a look at how the graph without 2020 results.
Graph 2: 2015-2019 Capital Balance
Once we remove the 2020 results, you can see in Graph 2 that the results were more consistent over the investment period. Even more important, the two different exit criteria are more closely aligned. This gives more confidence to employ this strategy going forward.
Looking at the graph, the initial capital of $2,000 grew to $446K in 4 years when the exit criteria is based on the number of days held (blue line). When the exit criteria was based on RSI level above 70, the account grew to $581K.
Excel is a powerful tool that can calculate virtually any metrics. Table 1 below shows the metrics based on investment period of 2015-2020. The returns are staggering as you can see in the green highlighted cells below. The winning trades vs. losing trades are also worth taking a closer look. The percentage wins were 75.44% and 89.47% for exit criteria based on 60 days hold and exit criteria based on RSI level above 70, respectively.
Table 1: 2015-2020 Result Metrics
Table 2 below excludes 2020 results and shows the metrics over 4-year investment period from 2015-2019. The annual returns and percentage wins are pretty similar to the 5-year scenario.
Table 2: 2015-2019 Result Metrics
Conclusion
Based on the results, this looks to be a very profitable trading strategy. Excluding 2020 results, the total return over the 4 year investment period is 22,207% and 27,367% for exit criteria of 60 days and =>70 RSI, respectively. The compounded annual growth rate is 286.5% and 307.1% for exit criteria of 60 days and =>70 RSI, respectively.
The total number of trades were 114 and 107 for 2015-2020 and 2015-2019, respectively. Win rates were above 70% in all scenarios tested.
These results are astonishing! Tesla is obviously a very unique company and a rare investment opportunity. Thus, this trading strategy will need to be tested on other stocks before it can be deemed a viable strategy.


Hello Neo, could you provide the excel sheet? I would like to backtest
Hello Neo, could you provide the excel sheet? I would like to backtest and make different assumptions. regards